The Night Shift Mystery: How a Textile Unit Found a Hidden 10-12% Energy Drain
In a mid-sized textile unit in Surat, India, the maintenance manager had a nagging feeling: the electricity bills seemed out of proportion to production output. On paper, everything appeared in order. Machines were scheduled correctly, shift logs were updated regularly, and no major breakdowns were recorded. Still, the monthly EB bills carried numbers that couldn’t be justified.
Rather than dismiss it as a billing anomaly and waiting for an audit, the maintenance manager decided to investigate and dig deeper. He began comparing day-shift meter readings with night-shift ones and closely observing the operations…
A Proactive Observation
One evening, during an unplanned walk through the shopfloor on a night shift, he noticed something odd. Machines that had finished their runs were still powered on. Compressors continued to run even though no looms were drawing air. Motors remained energized, fans spun away, and auxiliary equipment stayed active long past their intended production window.
The logbooks did not capture this detail. Operators had signed off everything as “normal.” To the naked eye, nothing looked wrong — yet energy was quietly being consumed without adding a single meter of fabric.
That was the hidden blind spot: consumption without contribution.
The Blind Spot in Numbers
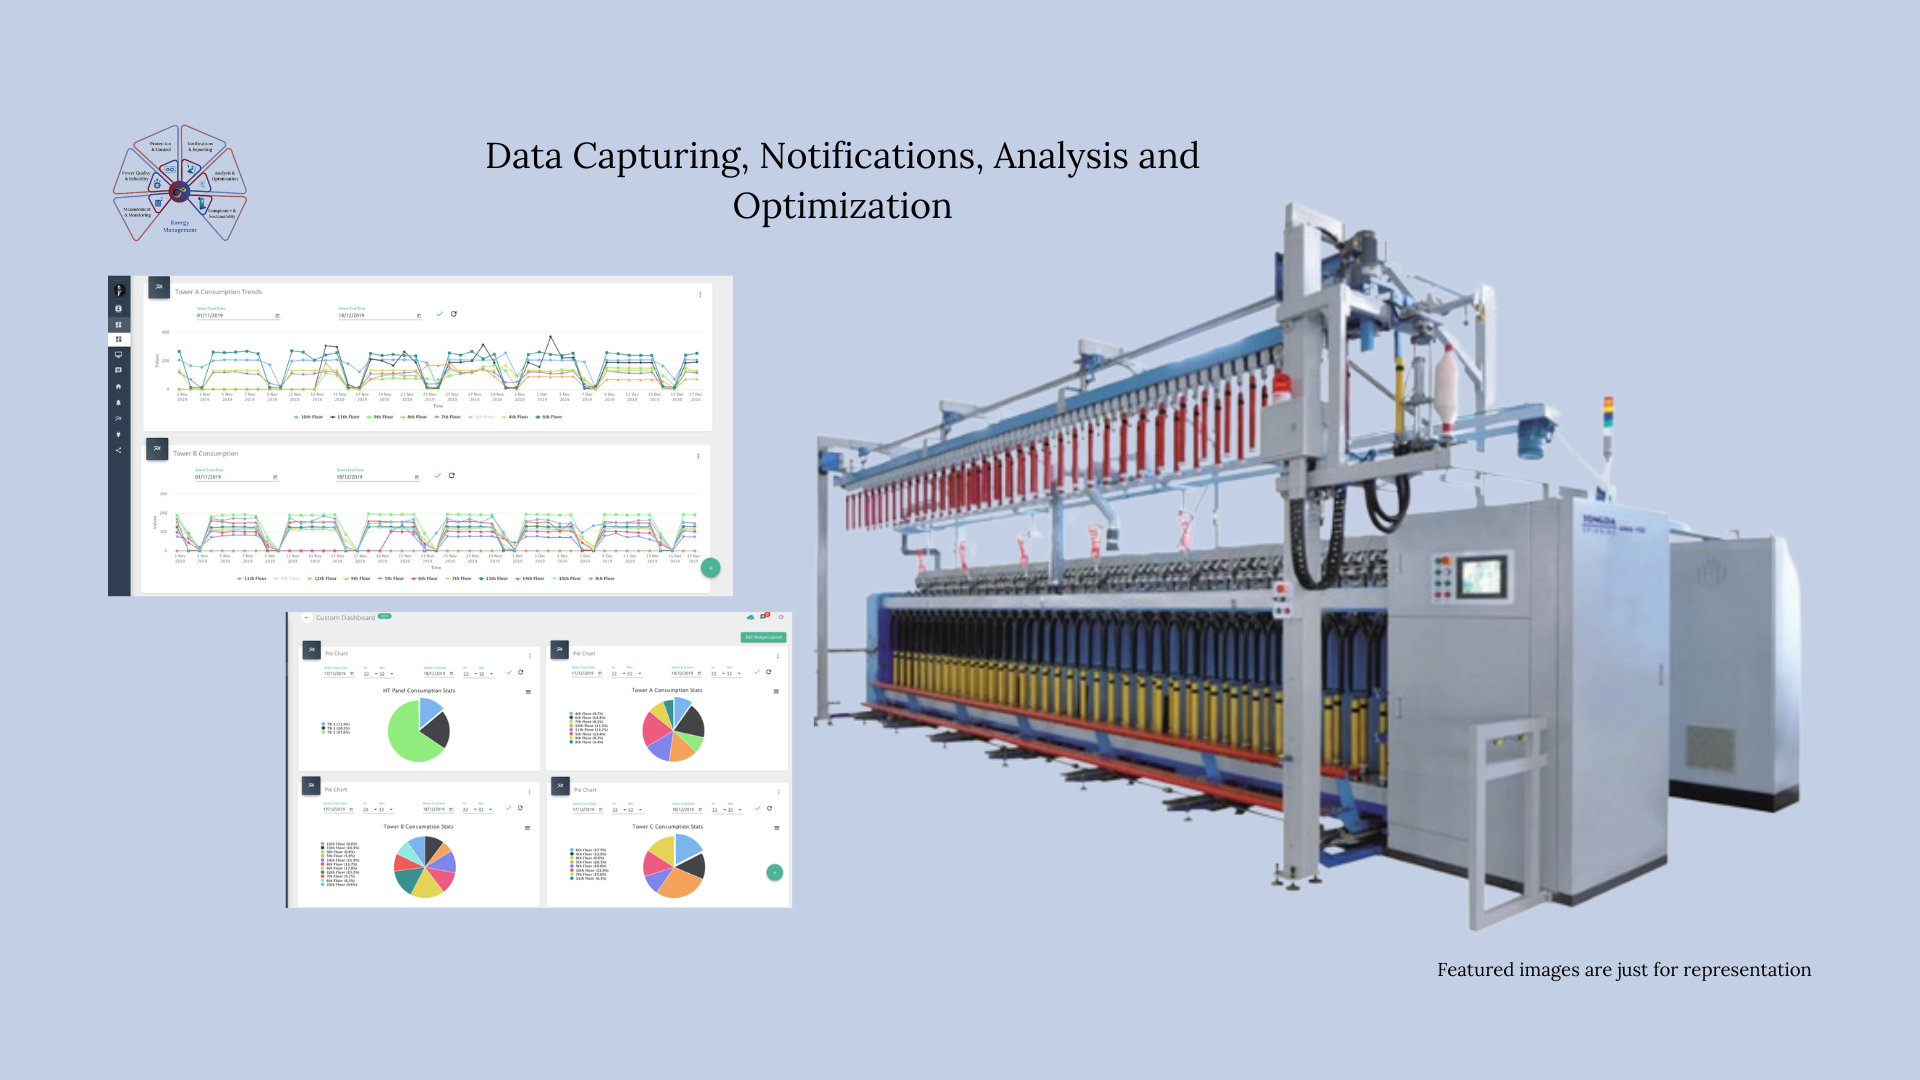
When feeder-level monitoring was introduced, the evidence surfaced quickly. The energy dashboards revealed a consistent pattern: night shifts were consuming about 10- 12% more energy than expected, even on days when production was low.
This clarity only came after the plant’s maintenance team, working with Intelliware, introduced feeder-level monitoring and data logging. Instead of relying only on the main incomer meter, they could now break down consumption across shifts and loads. Without sub-metering, this loss would have remained invisible. The EB bill reflected the extra cost, but it was impossible to trace it back to idle equipment. The factory had been carrying this invisible drain for months — maybe years.
Impact of Energy Monitoring on OEE
For the maintenance manager, this wasn’t just about saving electricity. It was about showing management how energy data connects directly to Overall Equipment Effectiveness (OEE).
- Availability: Machines appeared available, but idle running masked their true downtime. Without data, the plant assumed higher availability than reality.
- Performance: Energy consumed without actual throughput distorted utilization figures. The looms weren’t producing fabric, yet the meters kept running.
- Quality: Energy spent during idle hours produced zero output, indirectly lowering efficiency ratios and masking the true cost per good unit.
By framing the problem in terms of OEE, the maintenance manager shifted the conversation from “just another power bill issue” to “a production effectiveness issue.” That perspective resonated with management and finance alike.
From Insight to Action
The corrective strategy was practical, not expensive. Intelliware’s engagement with the unit was not about recommending large-scale automation from day one, but about building trust and visibility step by step.
The plan was simple:
- Start with feeder-level meters to separate EB and DG loads.
- Use basic dashboards to compare day vs. night consumption.
- Identify idling patterns and match them against shift schedules.
- Share findings with finance and production teams for corrective action.
Within weeks, operators were trained to shut down auxiliaries after runs, compressors were scheduled more tightly, and management had a live window into night shift consumption.
The ROI of Visibility
The results were tangible. The factory eliminated nearly all of the 12% night-shift wastage. Monthly bills stabilized. Operators became more disciplined. Finance began trusting maintenance reports because the data was transparent.
Beyond cost savings, the factory laid the groundwork for sustainability reporting. With cleaner EB and DG separation, Scope 2 emissions from electricity could be tracked more credibly. For the first time, the unit also had the baseline data needed for Scope 1 emissions from DG sets.
Most importantly, management saw that energy visibility was not an isolated maintenance activity — it was a business enabler.
The Bigger Picture
The textile unit’s experience reflects a broader challenge across small and mid-sized manufacturing plants. Blind spots are common wherever energy is measured only at the main incomer. They manifest as inflated bills, unexplained fuel consumption, hidden idling, or reactive power penalties.
The lesson is clear:
- Energy monitoring is not just about chasing savings.
- It is about linking maintenance, finance, and production into a single language of data.
- It is about making OEE meaningful by aligning availability, performance, and quality with real energy use.
Lesson Learnt
As the maintenance manager presented his findings to management, his message was straightforward:
“We can only improve what we can see. By turning blind spots into insights, we not only reduced waste but also strengthened the very foundation of our plant’s effectiveness.”
Turning Insights into Action
Energy blind spots rarely announce themselves — they hide in utility bills, downtime events, or unexplained performance losses. As this textile unit discovered, visibility at the feeder level was the key to uncovering wasted energy, improving OEE, and aligning maintenance with management goals.
Your Next Step
If you’re managing a plant and suspect hidden drains or unexplained downtime, feeder-level monitoring and data logging is often the most practical first step. Intelliware partners with maintenance, purchase, and management teams to:
- Map where blind spots exist in your current setup
- Recommend monitoring strategies that fit your budget and priorities
- Deliver actionable dashboards instead of raw numbers
📩 Connect with Intelliware to explore how small steps in visibility can unlock measurable ROI, improve OEE, and strengthen sustainability reporting.