Reactive vs Proactive Maintenance in Plastic Molding Unit: Turning Power Quality Data into Maintenance Intelligence
In a plastic moulding unit in the Delhi NCR region, the maintenance team had earned a reputation for their agility and problem-solving skills. Whenever a machine tripped or a circuit failed, they were quick to respond — diagnosing issues, restoring operation, and ensuring production resumed with minimal delay.
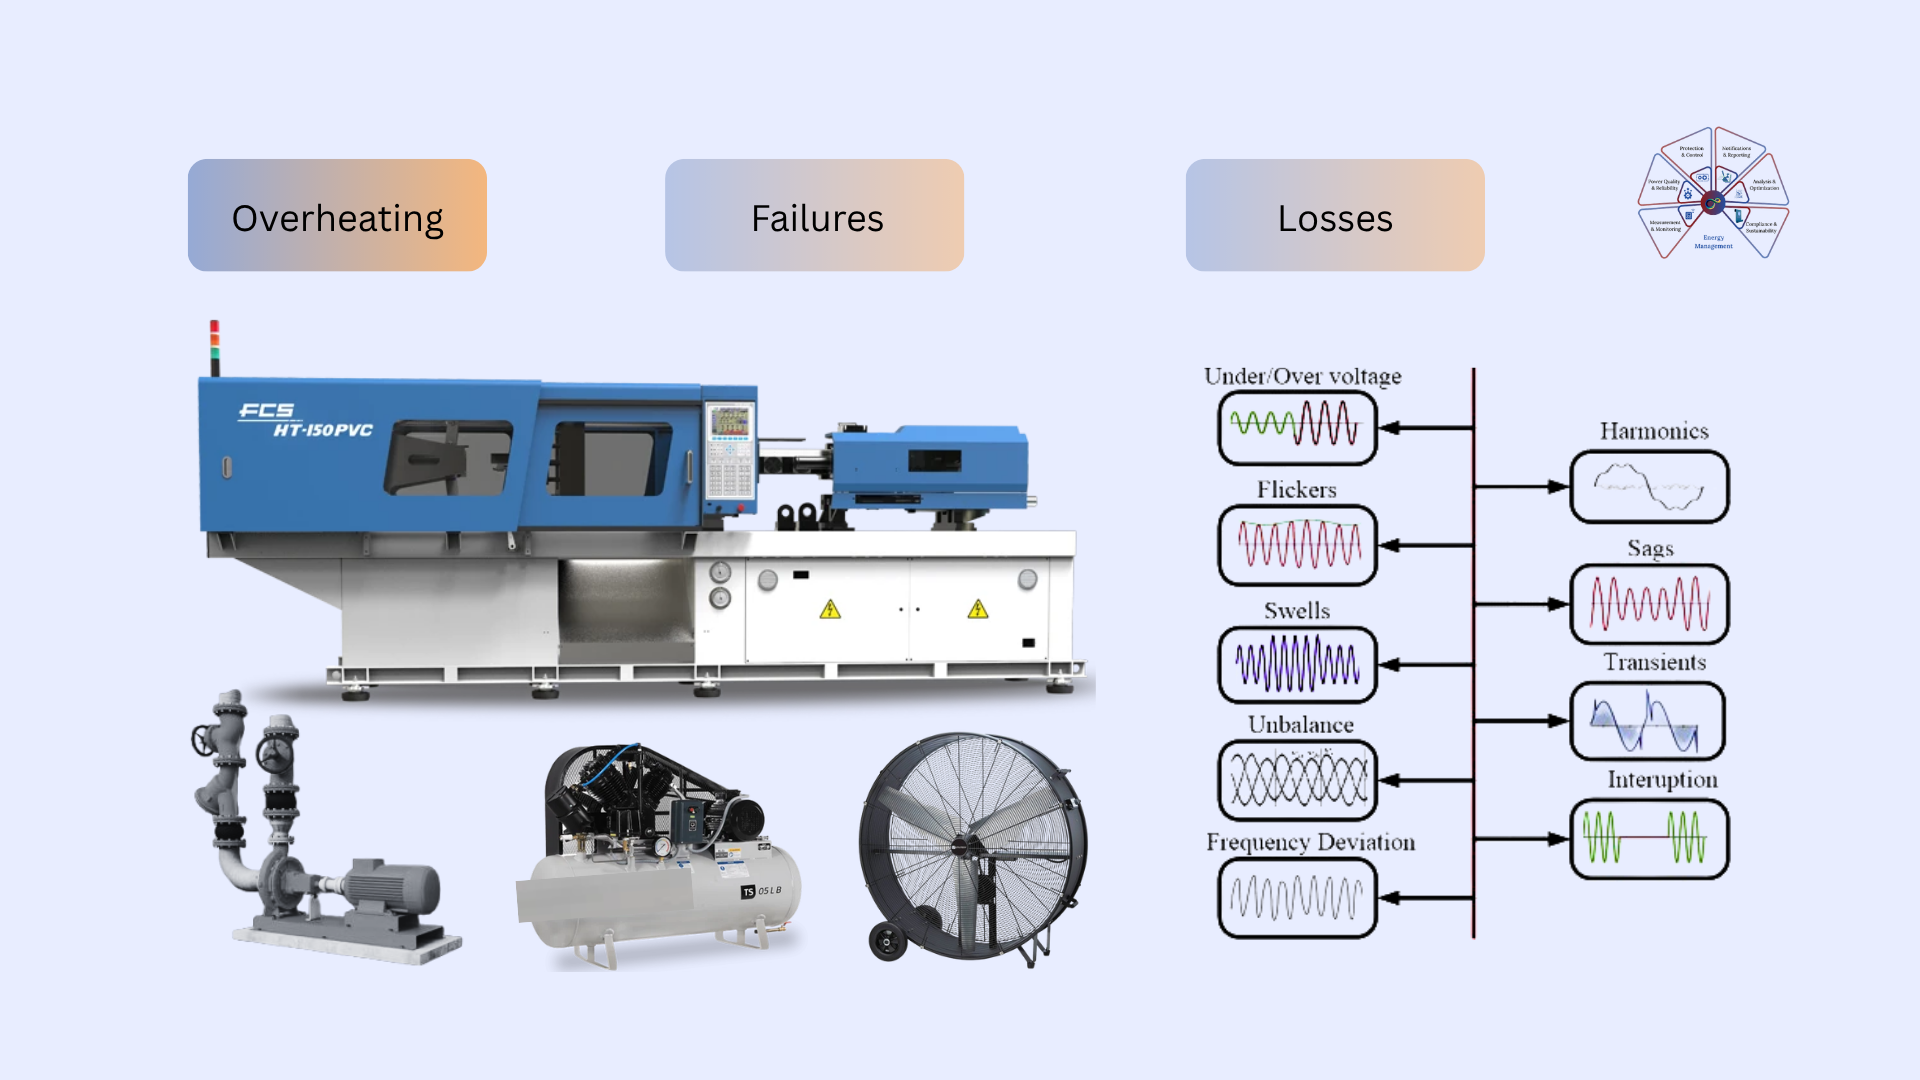
However, over time, the limitations of a purely reactive approach began to surface. Breakdowns were becoming more frequent, and injection molding machines started showing intermittent control system faults. Chillers that maintained molding temperatures were drawing unusually high currents, and compressors occasionally failed to start during voltage fluctuations.
During the routine monthly performance review, the plant head raised a few important concerns — the increasing frequency of maintenance interventions, unexpected equipment downtimes, and the resulting production and business impact. It was clear that a more systematic approach was needed — one that could help the team move from reactive firefighting to proactive maintenance planning.
This set the stage for a deeper discussion on energy and power quality monitoring — and how it could serve as a foundation for predictive maintenance and reliability improvement.
The Engagement: Moving from Symptoms to Visibility
Intelliware’s engagement with the plant began as an exploratory session — not about selling products, but about helping the team uncover what was really happening inside their electrical network.
The maintenance head explained the challenge clearly:
“We are not losing money in breakdowns alone. We are losing predictability. Every time a compressor or heater trips, we lose both energy and production time. We need to see what’s causing it.”
This conversation led to a joint decision — to install power quality monitoring across key load centers:
- Main incomer (to track incoming voltage and current imbalance)
- Moulding machine feeders (where high transient loads occur)
- Chillers and compressors (for voltage dip and reactive power behavior)
- Air conditioning and cooling systems (for peak-time load fluctuations)
The goal wasn’t just data collection. It was diagnostic insight — to move from firefighting to preventive planning.
What the Data Revealed
Within a few weeks of installing the Smart Power Quality Meters, the data spoke clearly.
- Voltage Fluctuations — during morning and evening peak hours, the supply voltage dipped by 8–10%, directly impacting the drive controls of moulding machines.
- Unbalanced Loads — phases feeding chillers and air compressors showed more than 15% current imbalance, stressing both cables and transformers.
- Reactive Power Variation — Power Factor fluctuated between 0.78 to 0.94, leading to both energy losses and EB penalty risks.
- Harmonics Distortion — total harmonic distortion (THD) crossed 12% during heater and motor startups, causing nuisance tripping of control relays and soft starters.
The root cause of unpredictable machine trips was no longer a mystery. It was poor power quality, impacting reliability, consistency, and ultimately OEE (Overall Equipment Effectiveness). The maintenance team mapped the data to production logs and found a pattern:
- Availability losses – Each tripping event led to 15–30 minutes of lost production time.
- Performance losses – Equipment ran slower or required rework during low-voltage conditions.
- Quality losses – Molding defects increased whenever heater bands or control circuits fluctuated.
Power quality issues were not just electrical — they were production issues. The insight transformed the plant’s perception of maintenance — from a support function to a performance enabler.
The Value Proposition for a Strategic Change
Armed with data and event logs, the maintenance head prepared a proposal to the plant management. The argument wasn’t emotional — it was logical, backed by trends and numbers.
Key points presented:
- Poor power quality caused up to 6% reduction in equipment availability.
- Maintenance interventions had increased by 40% over six months.
- Every downtime hour led to approximately ₹25,000 in lost production.
- Total monthly energy loss due to reactive and unbalanced loads was around 3–5%.
The management now had quantifiable visibility — something spreadsheets or EB bills alone could never reveal.
With this clarity, the management approved a two-stage implementation:
- Power Quality Monitoring Expansion – Covering all critical feeders and production lines.
- Corrective Action Plan – Incorporating Active Harmonic Filters (AHF) and ASVG (Automatic Static Var Generators) at targeted load centers.
The Corrective Solutions: Practical, Scalable, and Measurable
The corrective action was not a one-size-fits-all solution. Intelliware helped design an economically phased implementation aligned with the plant’s capital planning.
Step 1: Load Balancing and Source Correction
- Realigned compressor and chiller load distribution.
- Adjusted incoming transformer tap to stabilize low-voltage periods.
Step 2: Reactive Power Management
- Installed ASVG system for dynamic power factor correction.
- Reduced reactive energy losses and improved stability during motor starts.
Step 3: Harmonic Filtering
- Deployed Active Harmonic Filters (AHF) at moulding and heating machine feeders.
- Eliminated harmonic distortion and reduced false tripping.
The combination of monitoring + corrective solutions created a measurable impact, not just on energy bills but on the plant’s operational rhythm.
Post-Implementation Results
After six months, the changes were visible and measurable:
Operational Improvements:
- Reduction in unplanned stoppages by 58%
- Improved equipment availability from 91% to 96%
- Enhanced Power Factor to 0.99 with minimal penalties
- Lowered THD from 12% to 4% across main bus
Production and Quality Benefits:
- Reduced moulding defects due to heater voltage stability
- Consistent air compressor pressure improving process reliability
- Cooling system operated smoothly without frequent resets
The maintenance team’s shift from reactive to proactive was now backed by evidence.
The plant had effectively made power quality a measurable maintenance KPI.
Lessons Learned
The journey offered valuable lessons for other MSMEs facing similar challenges:
- Don’t wait for breakdowns — invest in visibility.
- Power quality = equipment health — not just energy bills.
- Monitoring is the foundation — without data, you’re blind.
- Phased investment works — start small, expand intelligently.
- Collaboration is key — maintenance, operations, and management must align.
These learnings helped the maintenance team evolve from repair-focused to reliability-focused.
The Future of Maintenance is Proactive
For the MSME unit, power quality monitoring was not a luxury — it became a necessity.
By moving from reactive firefighting to proactive diagnostics, the factory unlocked higher productivity, lower costs, and better control over its operations.
The next frontier now is integrating these insights into predictive maintenance — using data trends to forecast failures before they happen.
If you’re an MSME owner or maintenance professional facing similar challenges — voltage dips, equipment tripping, high energy costs, or hidden inefficiencies — now is the time to act.
Let’s discuss how Smart Power Quality Monitoring, ASVG, and Active Harmonic Filters can help you improve reliability and OEE.
- Call/SMS/WhatsApp: +91 8279921905
- email: contactus@intelliware.in
- Facebook: https://www.facebook.com/intelliware.in
- LinkedIn: https://linkedin.com/company/intelliware-in