From Voltage Sags to OEE Drops: Understanding Energy Reliability in Food Processing
In a mid-sized food processing plant in the Delhi NCR region, the maintenance team had begun noticing something strange. Despite no major machinery failures, the Overall Equipment Effectiveness (OEE) was slipping. Machines were running below expected throughput, the chiller system required frequent attention, and even well-maintained grinders and conveyors were occasionally underperforming.
What initially appeared to be routine wear and tear soon revealed deeper causes — power quality variations silently affecting the plant’s equipment, energy efficiency, and ultimately, profitability.
This case reflects the broader reality across India’s MSME food processing segment — where the cost of poor power quality often remains invisible until production efficiency drops or maintenance costs surge.
Inside a Food Processing Unit: The Energy Landscape
The unit operates in two shifts and includes a diverse mix of equipment, such as:
- Raw material processing equipment: peelers, grinders, crushers, slicers, and juicers
- Thermal equipment: boilers, heaters, pasteurizers, dryers, ovens
- Utilities: air compressors, blowers, pumps, conveyors and cooling towers
- Environmental systems: ETP (Effluent Treatment Plant) and STP (Sewage Treatment Plant)
- HVAC and refrigeration systems: chillers, condensers, cold storage compressors, and industrial fans
- Automation & control: PLCs, VFD drives, SCADA panels, and packaging line controllers
Each of these systems depends on stable voltage and frequency. Even a short sag, swell, or harmonic distortion can trigger control trips, misfire a heater element, or damage electronic drives.
The Maintenance Reality: When Issues Hide in Plain Sight
Initially, the plant’s maintenance team relied on routine checks and manual logging. Whenever a fault occurred — be it a tripped drive or an overheated motor — they investigated, replaced the damaged component, and resumed operations.
But over time, patterns started emerging:
- Motors in the peeling section frequently overheated, despite normal load conditions.
- PLCs on the packaging lines began rebooting randomly, particularly during peak hours.
- Compressors in the refrigeration section occasionally refused to start.
- Control relays in the ETP panel failed more often than expected.
- Heating loads showed variation in current draw, leading to uneven cooking or drying.
Despite all preventive maintenance practices, the mean time between failures (MTBF) was falling — and no clear mechanical cause could be identified.
The Turning Point: From Symptoms to Source
During one quarterly review, the plant head raised a pointed concern:
“Our maintenance logs show increasing downtime, yet spare parts consumption has doubled. We need to know why — not just replace more components.”
That triggered a detailed discussion between the maintenance, production, and energy management teams.
The consensus was clear — the issue was electrical, not mechanical.
So instead of another round of equipment replacements, they decided to start monitoring the power itself.
Deploying Energy Monitoring: Power Quality Visibility
The first step was to install multi-function energy meters and power quality analyzers across critical circuits.
These included:
- Main LT incomer (to capture overall plant signature).
- DG Supply changeover
- Sub-panels feeding chillers, compressors, and boilers.
- Control panels for grinders, peelers, and mixers.
- ETP motor control panel (often subject to high harmonics).
These meters were configured to capture and log parameters like:
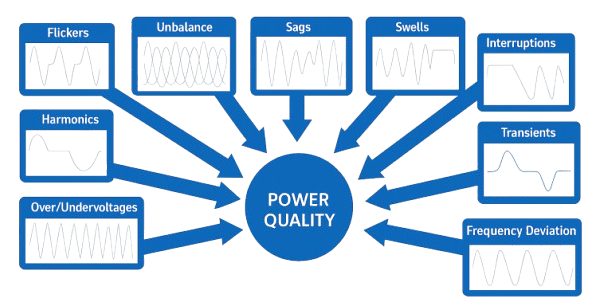
- Voltage & current (phase-wise)
- Frequency variations
- Voltage sags, swells, and dips
- Harmonic distortion (THD%)
- Power factor and reactive power flow
- Event logging for transients and interruptions
The data was centralized through a cloud-based energy monitoring system, enabling engineers to view trends, compare time periods, and generate exception reports automatically.
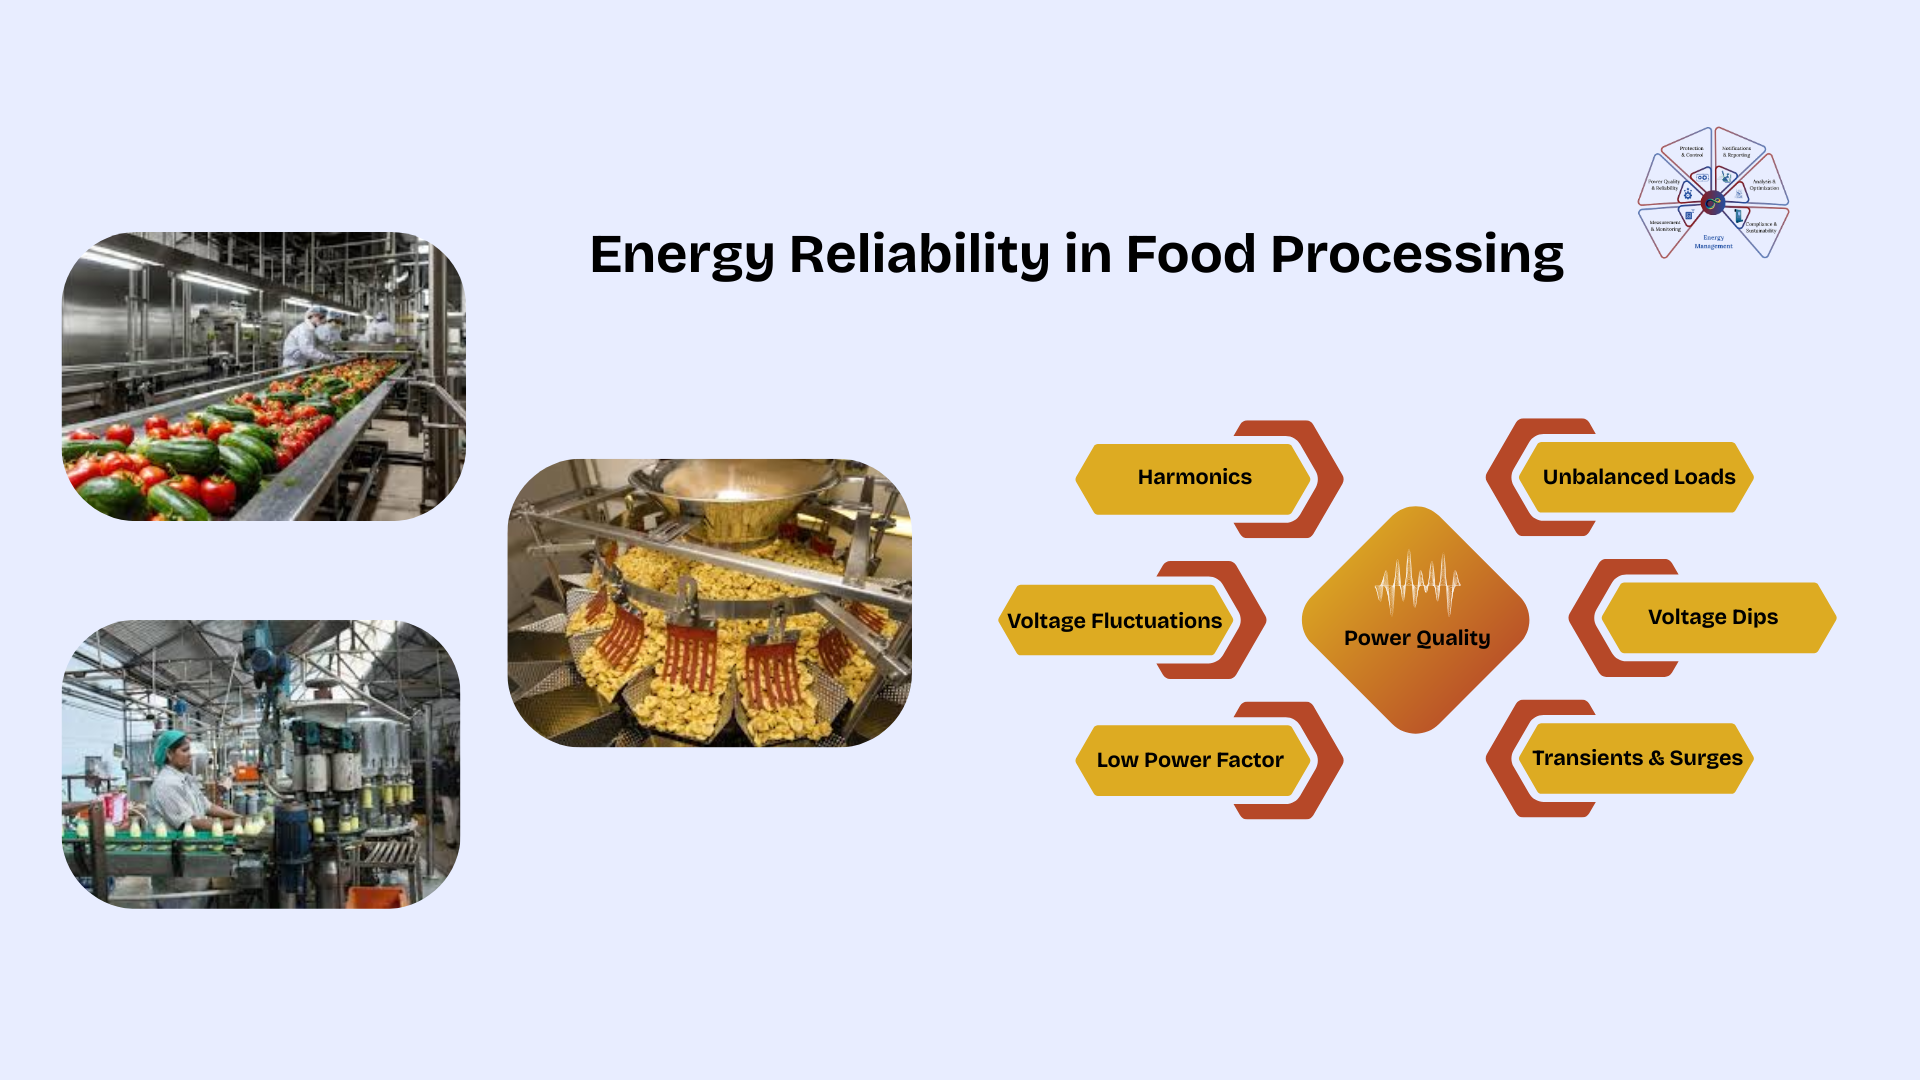
Short-term Discovery: Hidden Power Quality Disturbances
Within the first few weeks of data collection, patterns began to emerge — and they were eye-opening.
- Voltage Sags and Dips: Recorded every time heavy loads like compressors or chillers started. The voltage momentarily dropped below 190V (in single-phase circuits), causing sensitive PLCs and VFDs to reset.
- Voltage Swells: Observed when certain sections of the plant were shut down suddenly, causing the grid voltage to rise temporarily — enough to trigger overvoltage alarms on control panels.
- Harmonics: High levels of current harmonics (particularly 5th and 7th order) were traced back to variable frequency drives (VFDs) used in peelers and blowers. These harmonics caused excessive heating in motors and cables, reducing lifespan.
- Unbalanced Loads: Uneven current across phases was identified in the heater sections — particularly where single-phase loads were randomly distributed. This unbalance led to overheating in the neutral conductor and higher system losses.
- Low Power Factor Events: During high inductive load operations (like motor start-up), power factor dipped below 0.75 lag — leading to reactive energy penalties from the utility provider.
Each event, by itself, looked minor — but collectively, these distortions were robbing the plant of efficiency, reliability, and uptime.
Linking of Power Quality with OEE
To most managers, OEE (Overall Equipment Effectiveness) is about availability, performance, and quality. But hidden within those factors is the invisible influence of power quality.
Let’s break that down:
| OEE Component | Hidden Power Quality Impact |
|---|---|
| Availability | Unplanned stoppages due to tripped drives, relay failures, or PLC resets |
| Performance | Reduced machine speed during low voltage or harmonic conditions |
| Quality | Batch inconsistencies due to fluctuating heater loads or chiller temperature variations |
In this food processing unit, once the monitoring data was analyzed, it became clear that power quality was directly impacting OEE resulting in fewer batches produced, delayed deliveries, and rising maintenance costs — even though the machines themselves were in good condition.
Financial and Business Implications
When translated into business numbers, the findings were significant:
- Each hour of downtime during peak production resulted in ₹40,000–₹60,000 of lost output.
- Over a month, power quality–related stoppages added up to nearly ₹4–5 lakhs in direct production loss.
- Increased maintenance and spare part replacements cost another ₹2–3 lakhs monthly.
- Product rejections due to process inconsistency were estimated at 3–5% of total output.
These weren’t just operational issues — they were profitability leaks.
Strategic Corrective Measures and Implementation
With energy monitoring data as the foundation, the plant adopted a series of focused corrective actions:
- Load Balancing and Phase Correction: Redistribution of single-phase heaters and auxiliary circuits reduced current unbalance by 40%.
- Installation of Active Harmonic Filters: Reduced THD levels from 18% to below 5%, minimizing heat stress on motors and drives.
- Automatic Power Factor Correction (APFC) Panels: Improved average power factor from 0.76 to 0.96, eliminating reactive power penalties.
- Surge and Transient Protection Devices: Installed at main panels and sensitive control circuits to safeguard PLCs and instrumentation.
- Sequenced Motor Starting Logic: Implemented to prevent simultaneous high-current draw, stabilizing the supply during compressor and chiller starts.
- Periodic Energy Reports & Alerts: Weekly summaries automatically highlighted unusual energy trends — allowing proactive maintenance scheduling before a breakdown occurred.
Medium-term Impact: From Data to Dependability
Within three months of implementation, the results were visible and measurable:
- Unplanned downtime reduced by 35%
- Maintenance interventions dropped by 28%
- Power factor penalties eliminated completely
- Average equipment life extended by 10–15%
- OEE improved by 7-8% overall
And perhaps most importantly — the maintenance team moved from firefighting mode to strategic reliability planning.
They were now able to predict which section was likely to show faults, plan shutdowns more efficiently, and justify capital upgrades with accurate data.
Lessons for MSME Food Processors
The case offered several takeaways applicable across the MSME food industry:
- Don’t wait for breakdowns — monitoring power quality can uncover invisible losses before they hit production.
- OEE is not only mechanical — electrical health plays a major role in performance and availability.
- Small monitoring investments can prevent large production losses.
- Prioritize high-impact zones — chillers, compressors, heaters, and control panels are ideal starting points.
- Use data for maintenance scheduling — identify recurring dips, harmonics, or overloads to plan interventions.
In short, visibility precedes efficiency. Once you see what’s going wrong electrically, it becomes easier to fix what’s failing operationally.
Call to Action
Curious how power quality is affecting your factory’s OEE?
👉 Visit www.intelliware.in or reach out for a free preliminary assessment of your power quality profile.
- Call/SMS/WhatsApp: +91 8279921905
- email: contactus@intelliware.in
- Facebook: https://www.facebook.com/intelliware.in
- LinkedIn: https://linkedin.com/company/intelliware-in