From Blind Spots to Insights: Building Energy Visibility in Mid-sized Manufacturing Units
When Meters Fail to Deliver Real Insights
Most manufacturing units start their energy management journey with energy meters (EM) or multifunction meters (MFMs). These devices display voltage, current, power factor, and kWh — but too often, the data remains stuck at the panel. Without logging, trending, or analysis, engineers see numbers but can’t connect them to wastage, inefficiency, or avoidable costs. Over time, this creates “energy blind spots” that delay corrective action.
The Trigger: A Familiar Plant Story
At a mid-sized auto-component plant in Delhi NCR, the maintenance team had invested in multiple digital energy meters across their distribution panels. The logic was simple:
“If we can measure energy consumption feeder by feeder, we can control costs and reduce downtime.”
Six months into the rollout, the reality looked very different.
- Motors continued to trip during EB–DG transfers.
- Neutral imbalance kept triggering unexplained alarms.
- Despite spending on “modern” meters, downtime hours didn’t reduce, and management was frustrated.
The Head of Maintenance put it bluntly during a review meeting:
“We have numbers, but no insights. The meters show kWh, but when a line goes down, they don’t help us prevent or predict the problem.”
This is a common gap across industries. Installing meters is often mistaken for monitoring. But meters alone rarely address the real challenges that engineers and managers face every day.
Different Perspectives, One Problem
For plant engineers, the priority was to solve immediate problems like unexplained downtime, high diesel generator bills, and penalties on power factor. For management, it was about financial visibility — knowing where costs were rising. Without shared visibility, each team had partial information. Adding data logging bridged this gap, because the same set of numbers could now be viewed as technical trends and as financial impact.
When Intelliware engaged with the plant, the approach was not to sell more meters, but to map the failure patterns and understand where the current monitoring fell short.
The joint discovery with the client’s maintenance team revealed:
- Data silos: Each meter worked independently, no central dashboard.
- Reactive troubleshooting: Engineers only checked readings after a trip.
- Missed patterns: Load imbalances during DG running were visible only if someone stood in front of the meter at the right time.
- Reporting gap: Management had no way to connect energy data with production output, nor to generate Scope 2 emission reports for their sustainability audits.
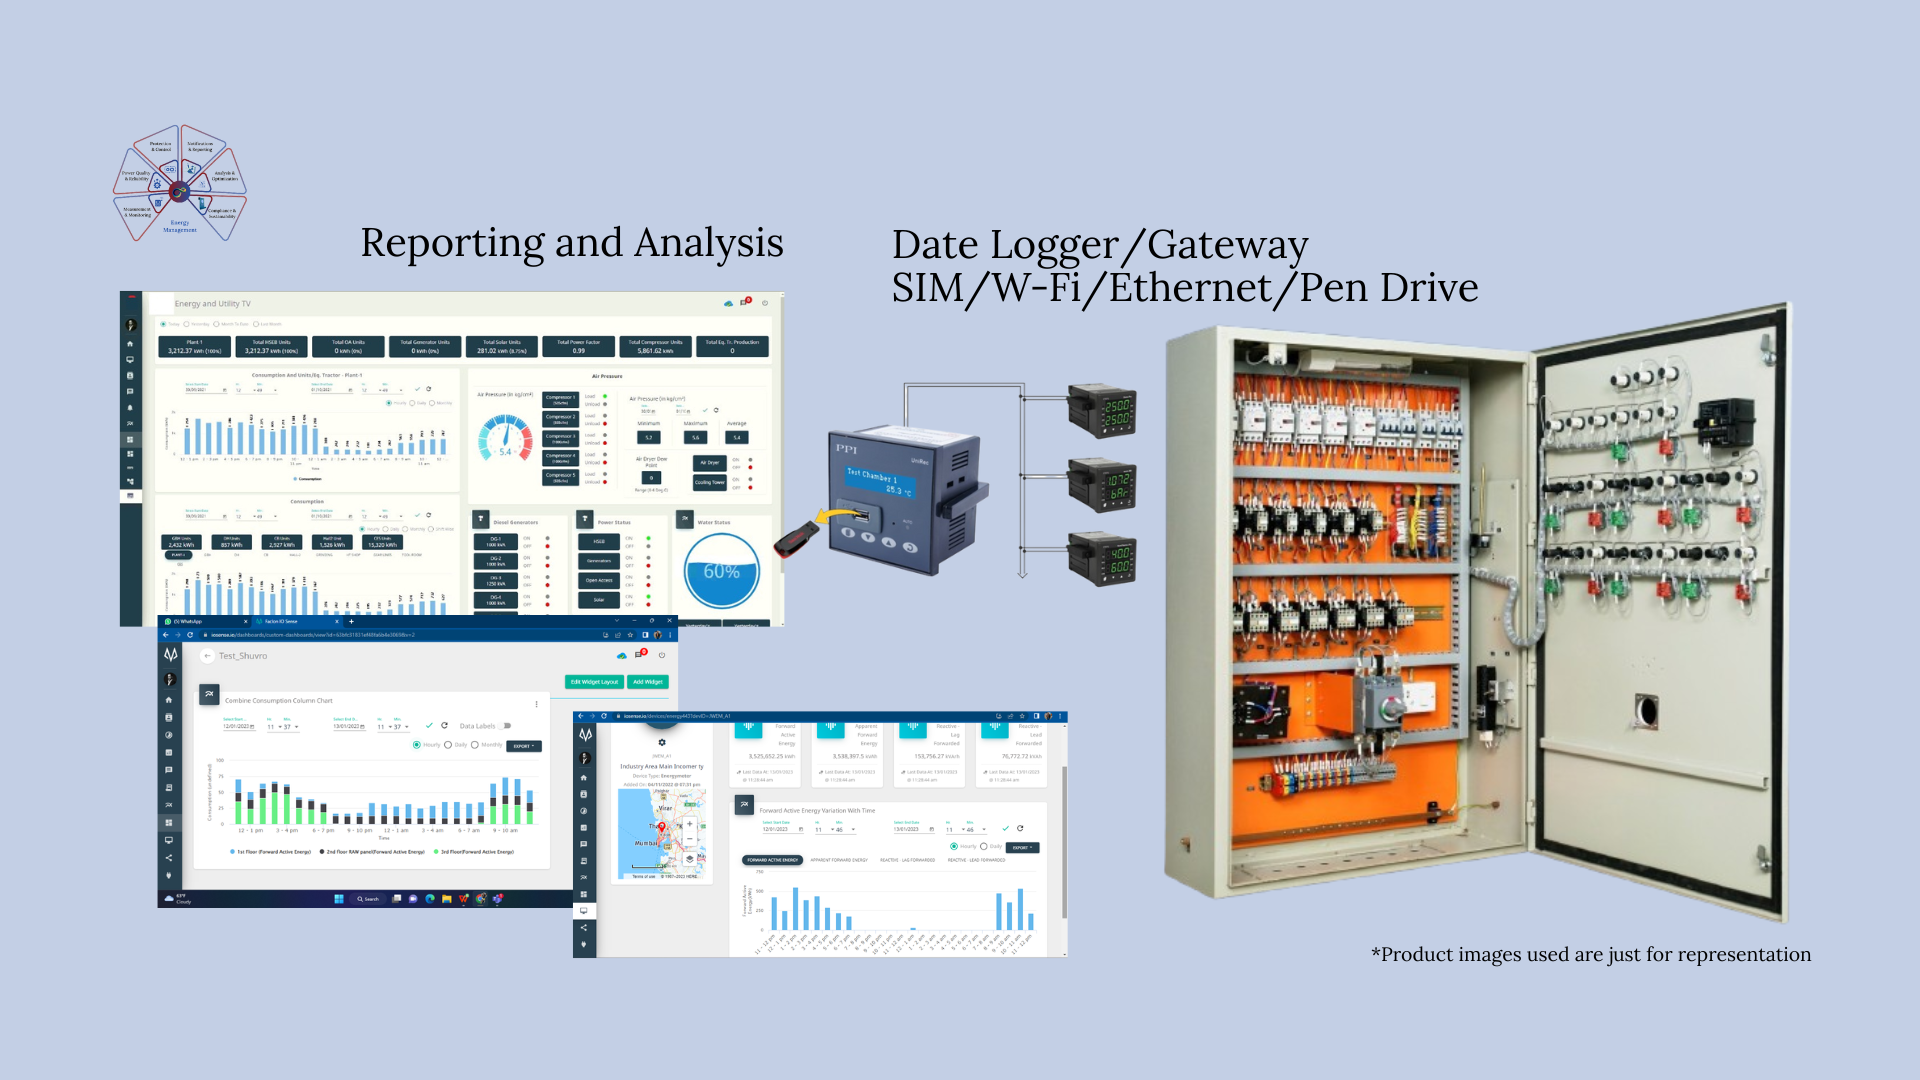
Instead of recommending another “box,” Intelliware worked with the team to network existing meters, set up a data capture and transfer system, building a reporting dashboard, and train engineers to use trend data instead of point readings.
Cross-Functional Alignment
Maintenance Engineer’s View
- Energy meters displayed instantaneous values, but without logs, there was no way to analyze why a feeder tripped last night.
- Harmonic distortion, neutral unbalance, or sudden load spikes were not obvious from manual checks.
- Once the meters were networked, engineers could scroll back through historical graphs and correlate downtime events with electrical anomalies.
Management’s View
- The management team realized that although they had “invested in meters,” they were not leveraging them for downtime prevention or energy productivity improvement.
- By linking logged kWh data with production output (units produced), they created a “kWh per unit” KPI.
- This became not just a cost measure but also a sustainability metric directly tied to their Scope 2 GHG reporting.
Procurement’s View
- Procurement had earlier focused on lowest-cost meters while comparing vendors.
- But in hindsight, the absence of communication capability (RS485 Modbus, Ethernet) had made the first phase ineffective.
- They realized that vendor evaluation cannot be based on unit price alone, but must include:
- Integration capability
- Software compatibility
- Reporting formats for audits and ESG disclosures
This was a rare moment where all three functions — maintenance, management, and procurement — found themselves aligned on the same outcome.
Decision-Making Insights (Beyond Specs)
The client’s leadership team debated several choices before finalizing their monitoring approach. Intelliware facilitated this evaluation:
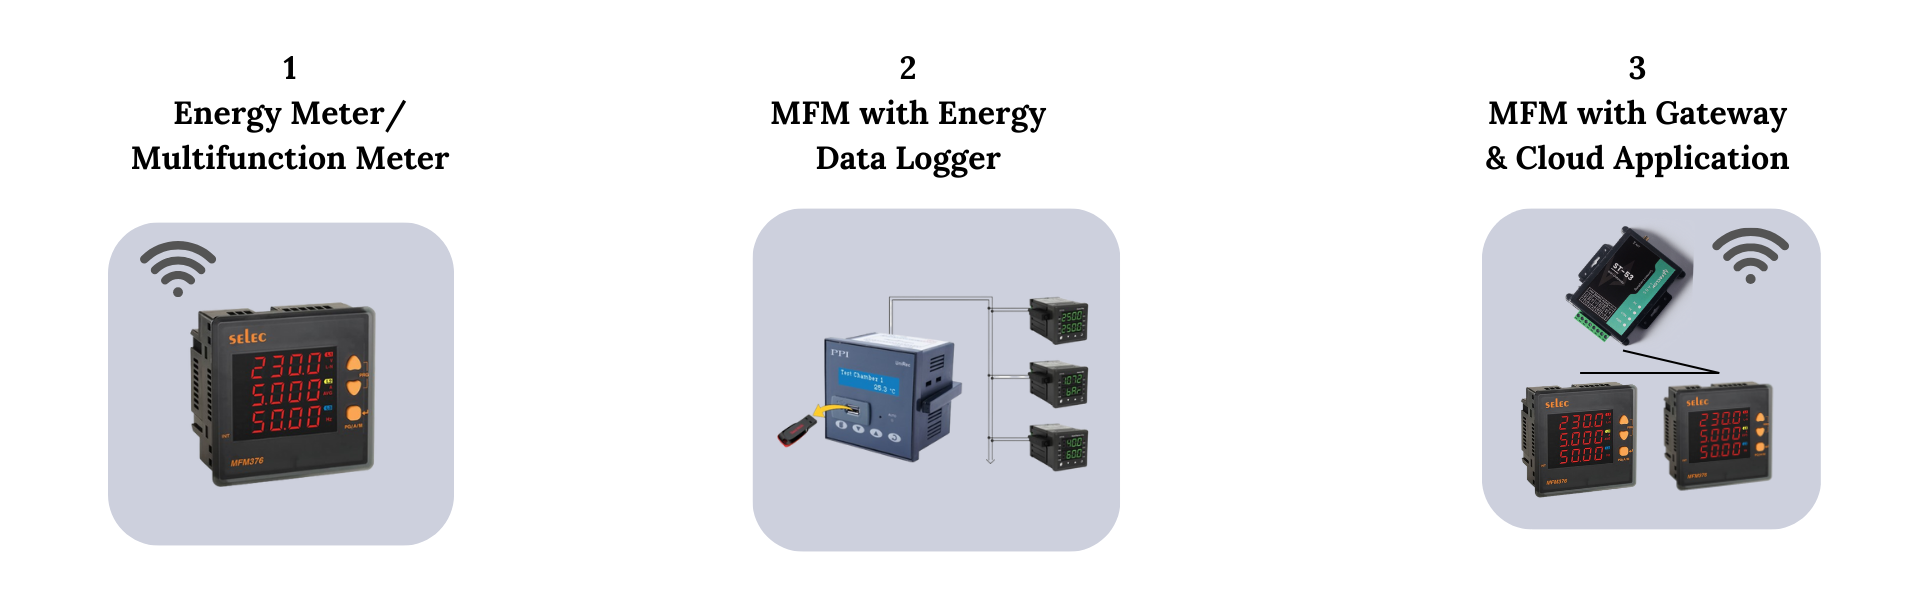
Option 1: Standalone Energy Meters/MFM
- Lowest upfront cost.
- Engineers must manually note readings.
- No history, no analysis — useful only for billing verification.
Option 2: Networked Meters + Data Logger
- Moderate investment.
- Provides historical logs of voltage dips, current imbalance, PF variation.
- Enables root-cause analysis of downtime.
Option 3: Integrated Energy Monitoring System (EMS)
- Highest upfront investment.
- Central dashboard with real-time alarms.
- Auto-generated reports for energy, downtime, and sustainability (Scope 2 emissions).
The team finally chose Option 2, with a roadmap to evolve into Option 3. The reasoning:
- Maintenance needed immediate troubleshooting help (downtime focus).
- Management needed trend data to link energy with productivity.
- Procurement wanted a staged investment approach without big capex in one go.
The Key Learnings
- Start with what you have — don’t discard functional meters.
- Use loggers as a bridge step if EMS feels “too big, too soon.”
- Look at energy not only as numbers but as actionable insights for cost, efficiency, and reliability.
This balanced decision meant everyone’s priorities were addressed — a key success factor in industrial decision-making that rarely gets discussed in spec sheets.
What Changed During the Following 12 Months
Six months after implementation, the plant recorded clear results:
- Zero unexplained feeder trips during EB–DG transitions. Engineers could trace every event to logged imbalance patterns.
- 14% improvement in downtime hours, as preventive checks were now based on trend analysis.
- Management began using energy per unit output as a core KPI, which doubled as a Scope 2 GHG emission intensity metric.
- Procurement noted that the staged investment avoided waste and created a future-ready foundation for expansion.
By the 12th month, the plant had generated its first credible GHG Scope 2 report based on actual logged energy data — a step that improved supplier ratings with global OEM clients.
Actionable Takeaways
For Maintenance Engineers
- Standalone meters are diagnostic tools, not monitoring solutions.
- Always demand data logging capability (even if offline).
- Match logging intervals to your problem statement (1 min logs for downtime analysis, 15 min logs for billing & demand).
For Management
- Link energy data with production metrics to create true productivity KPIs.
- Use energy monitoring as a sustainability enabler — not just cost control.
- Factor downtime cost when calculating ROI, not just the price of the meter.
For Procurement
- Compare integration and reporting capability, not just meter cost.
- Insist on open protocols (RS485, Modbus) for future-proofing.
- Include GHG Scope 2 reporting requirements in technical specifications to avoid re-investment later.
Energy Monitoring Through a Sustainability Lens: Scope 1–2–3
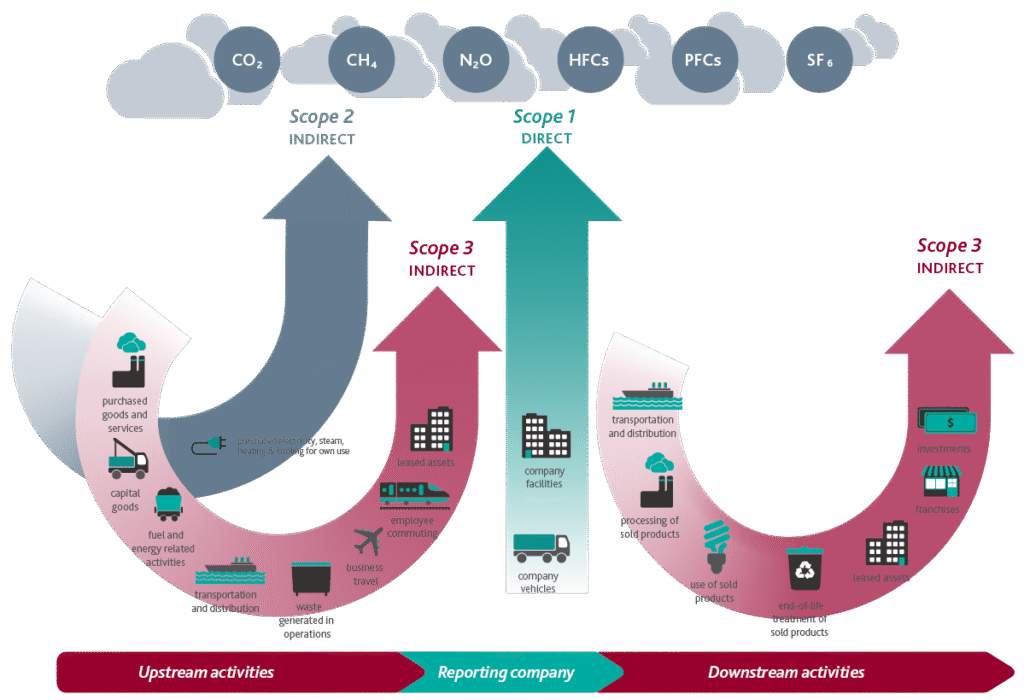
- Scope 1 (direct fuel use): Energy meters don’t measure this directly, but logged data helps calculate load shifts to DG sets.
- Scope 2 (purchased electricity): This is where networked meters add huge value, enabling accurate reporting of grid consumption and emission factors.
- Scope 3 (supply chain): Plants that share logged energy + emission intensity with OEM customers improve supplier ratings, which increasingly drive global contracts.
Thus, a simple step like upgrading from standalone to networked meters has triple impact: downtime reduction, cost control, and sustainability reporting.
The Bigger Picture: From Numbers to Outcomes
Energy visibility isn’t about fancy dashboards — it’s about outcomes: reduced penalties, lower fuel use, better budgeting, and greener operations. For mid-sized manufacturing units, the path from blind spots to insights doesn’t always require a giant leap. Sometimes, the smartest move is a small but strategic step.
Energy meters are often seen as an end in themselves — a “check-box” for modern plants. But as this Pune example shows, meters without monitoring are like thermometers without a doctor: they tell you numbers, but don’t help you heal.
When meters are networked, logged, and aligned across maintenance, management, and procurement priorities, they become a strategic tool — reducing downtime, improving productivity, and strengthening sustainability commitments.
That’s the real value Intelliware helps unlock: turning data into decisions, and decisions into outcomes.
✅ Ready to take the next step?
At Intelliware, we help manufacturing units bridge the gap between basic metering and advanced energy management. Whether it’s choosing the right meters, adding data loggers, or planning for a full EMS, our goal is to make your energy visible, actionable, and sustainable.
- Call/SMS/WhatsApp: +91 8279921905
- email: contactus@intelliware.in
- Facebook: https://www.facebook.com/intelliware.in
- LinkedIn: https://linkedin.com/company/intelliware-in